LMS Reporting and Training Analytics
Reports and analytics
LMS reporting that answers “who has finished their training?”
Learnwick’s LMS reporting shows completion, overdue training, time spent, quiz results and activity for every course and team — and lets you build your own analytics dashboards. Export anything to CSV or PDF in one click.
Free for up to 30 learners · No credit card
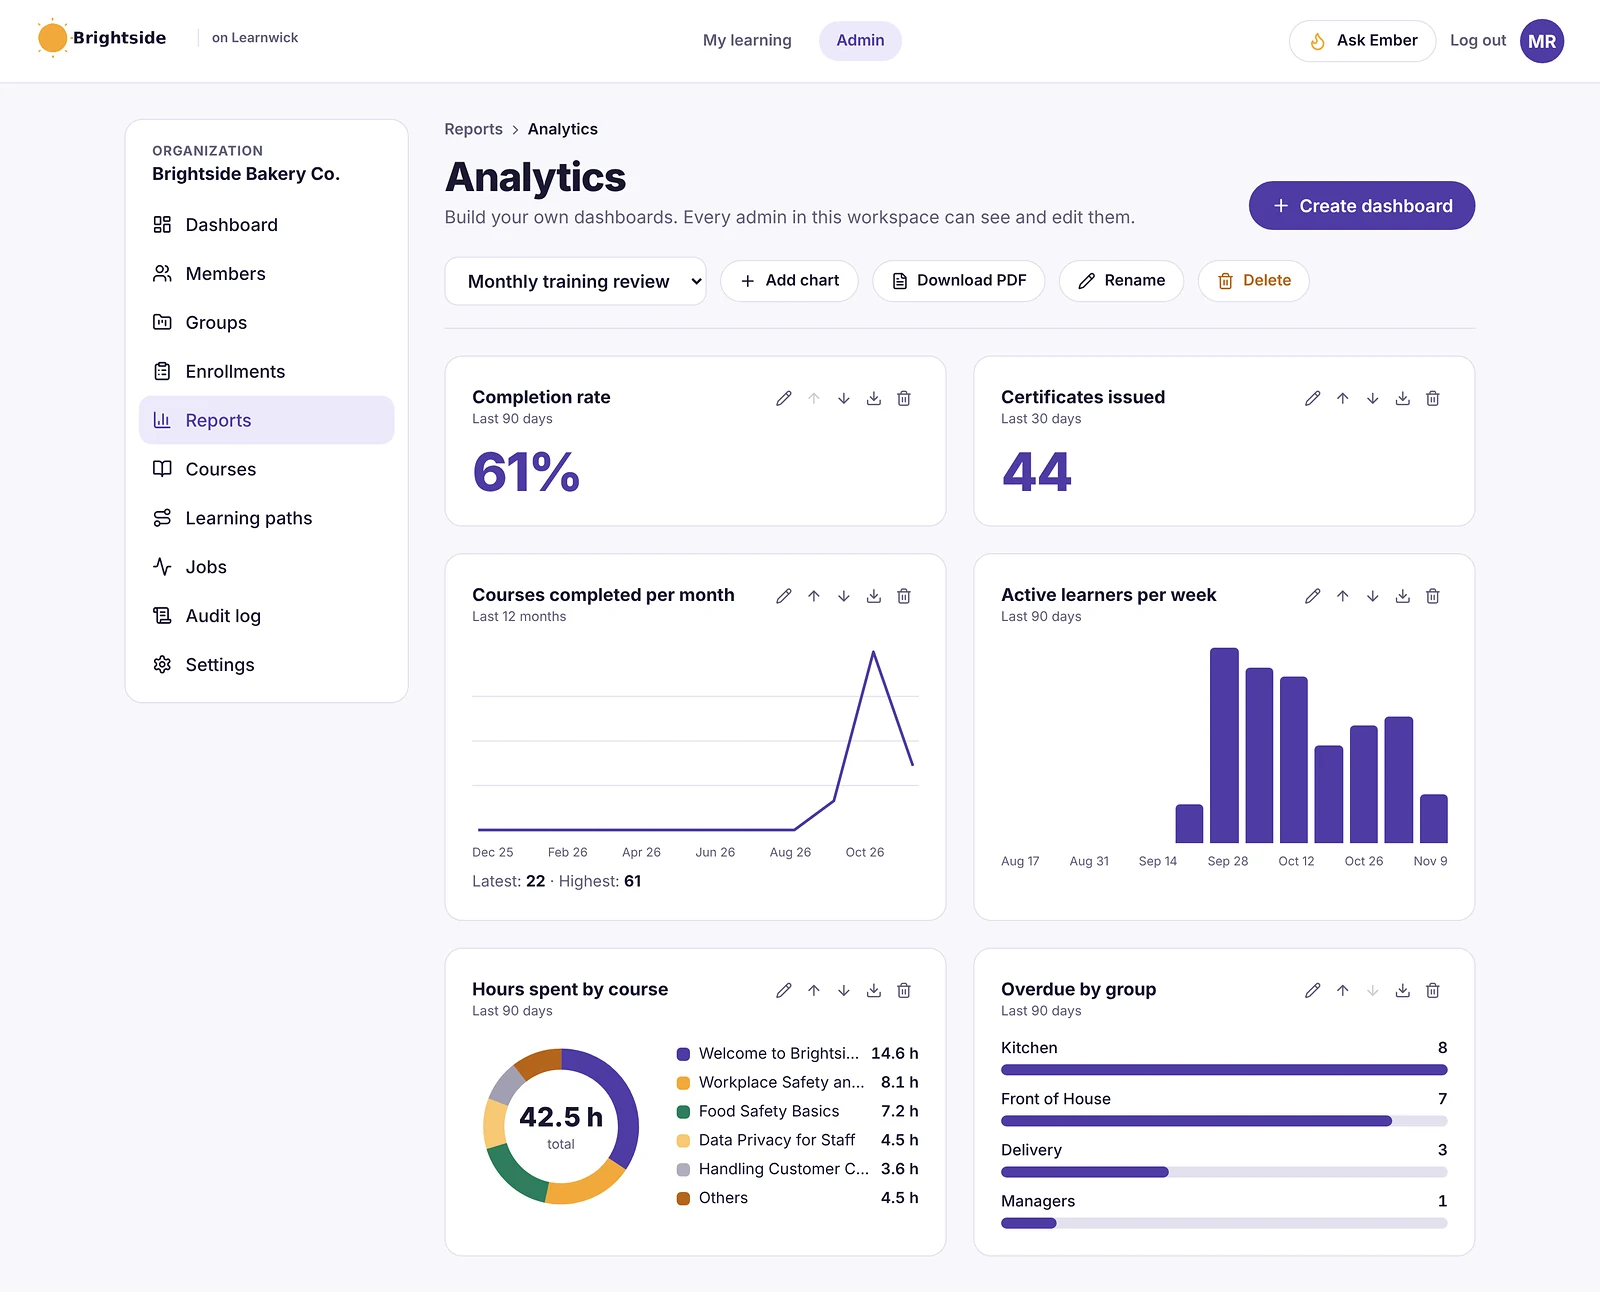
Training analytics dashboards you build yourself
Start with suggested charts — completion rate, certificates issued, completions per month, active learners, hours by course and overdue by group — then change them or add your own. Dashboards are shared with every admin and download as a PDF.
Ready-made training reports
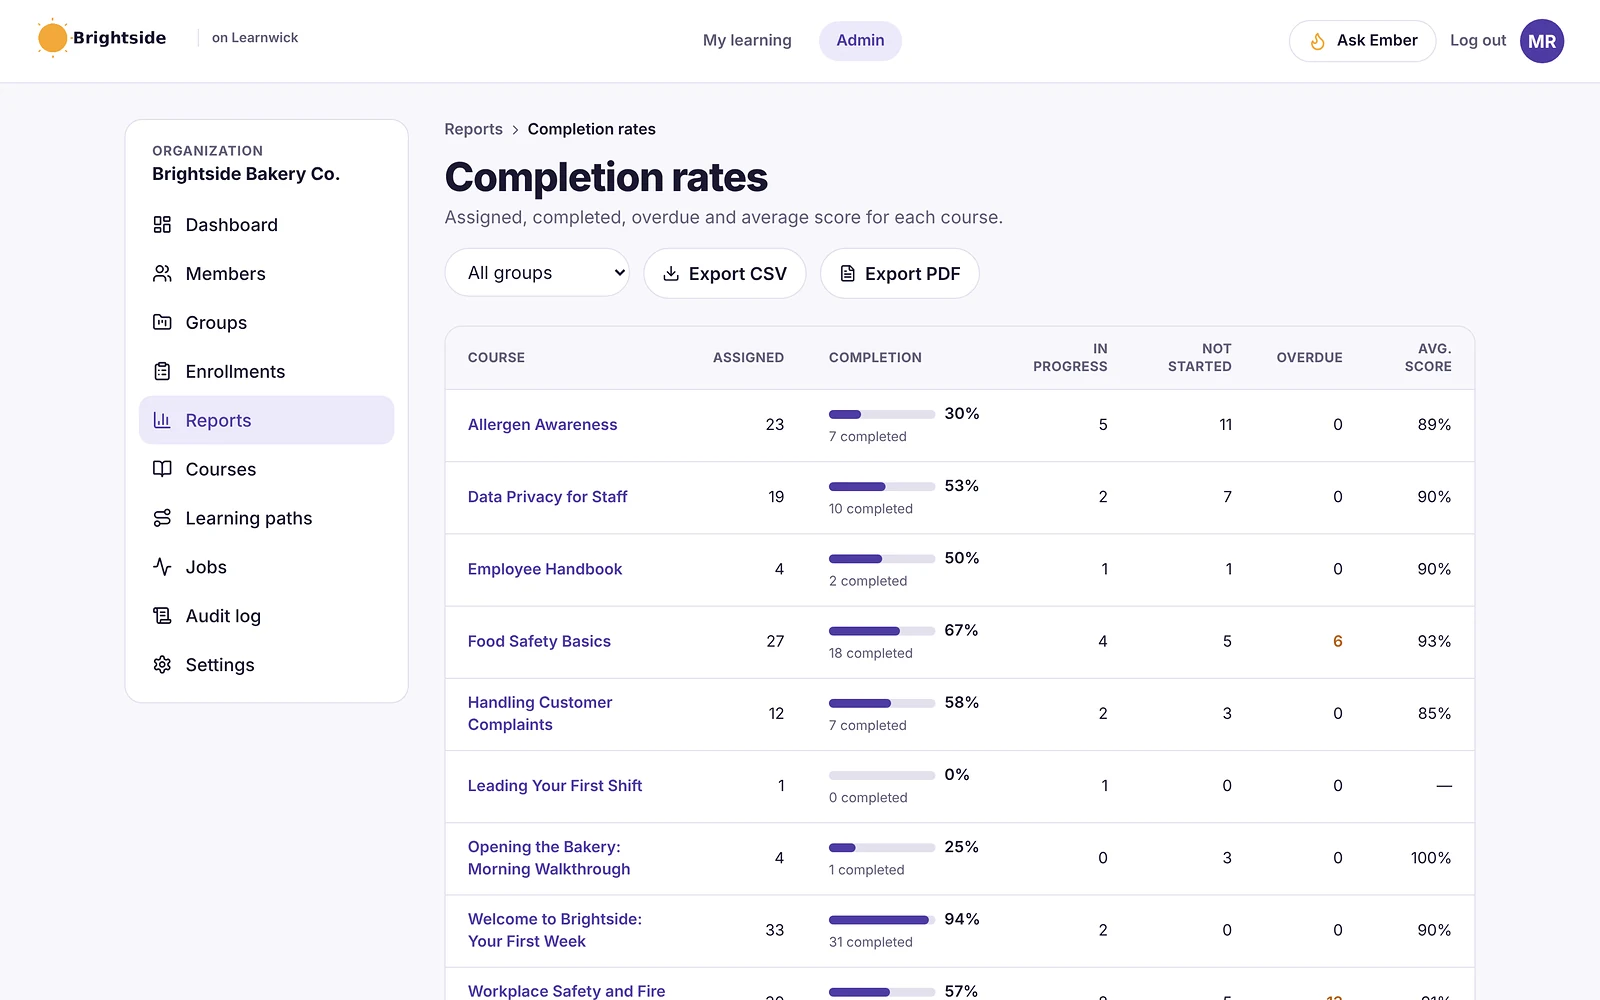
Open a report and the answer is there: completion rates per course, overdue training, people at risk of missing a due date, time spent learning, an activity timeline and quiz performance. Filter by group and export to CSV or PDF.
- Completion rates
- Overdue and at-risk training
- Time spent
- Activity timeline
- Quiz performance
- Custom reports with your own rules and columns
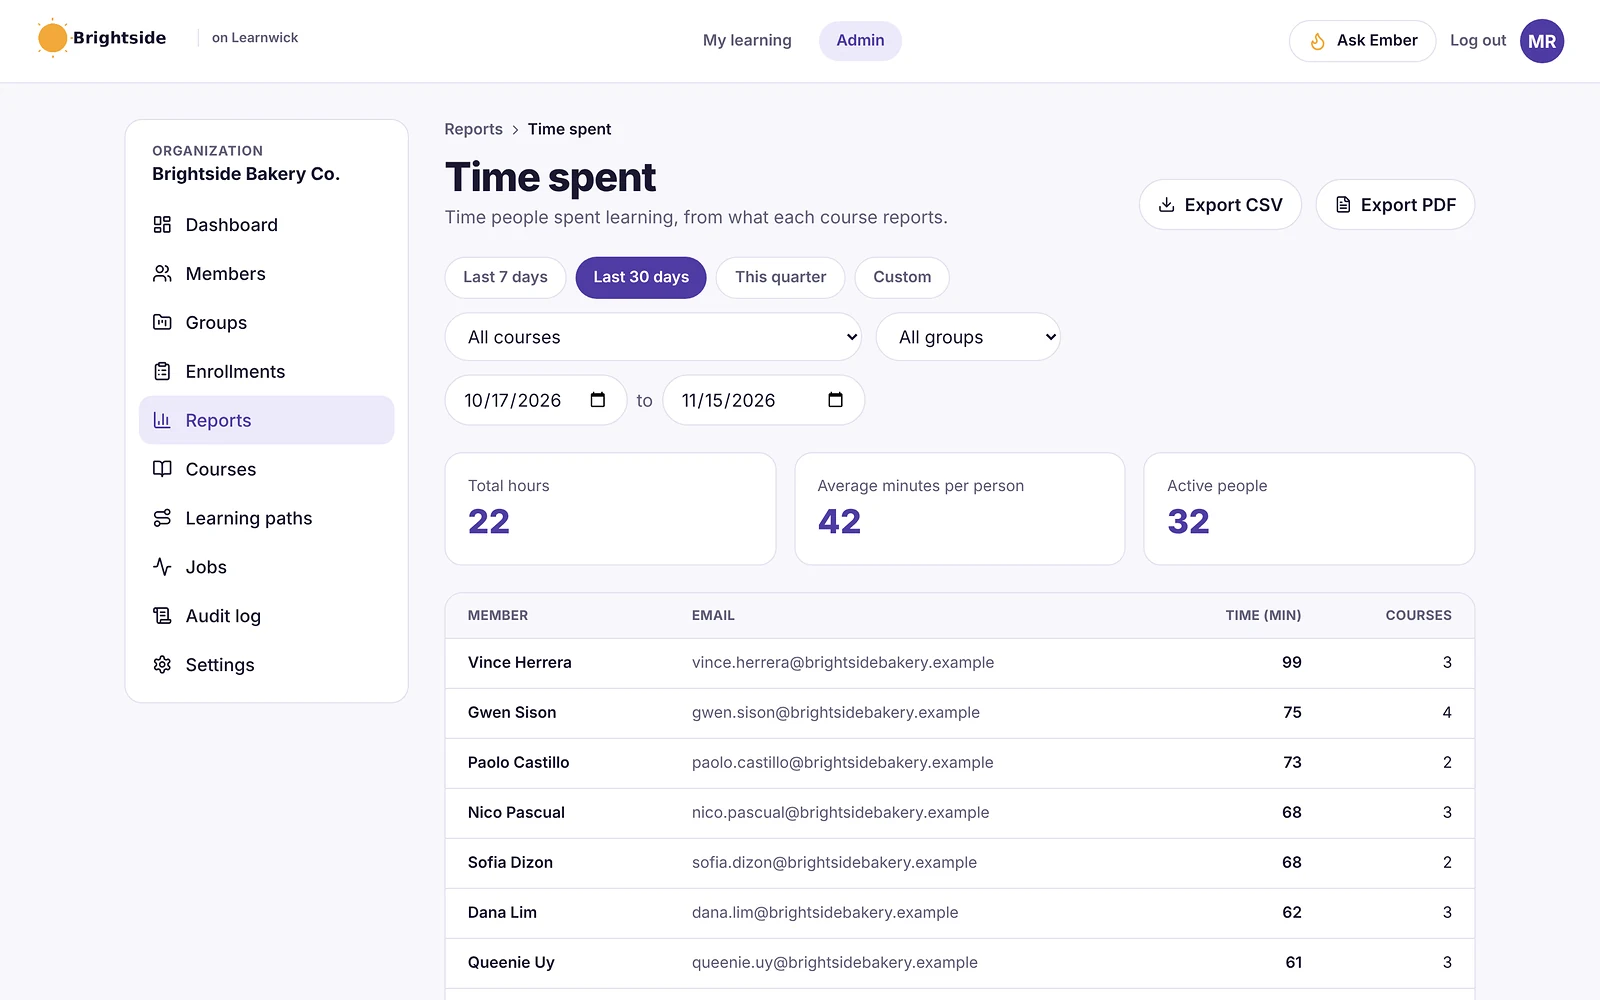
Time spent learning
See how many hours each person and each course took, for any date range — useful for training budgets, CPD records and spotting courses that are too long.
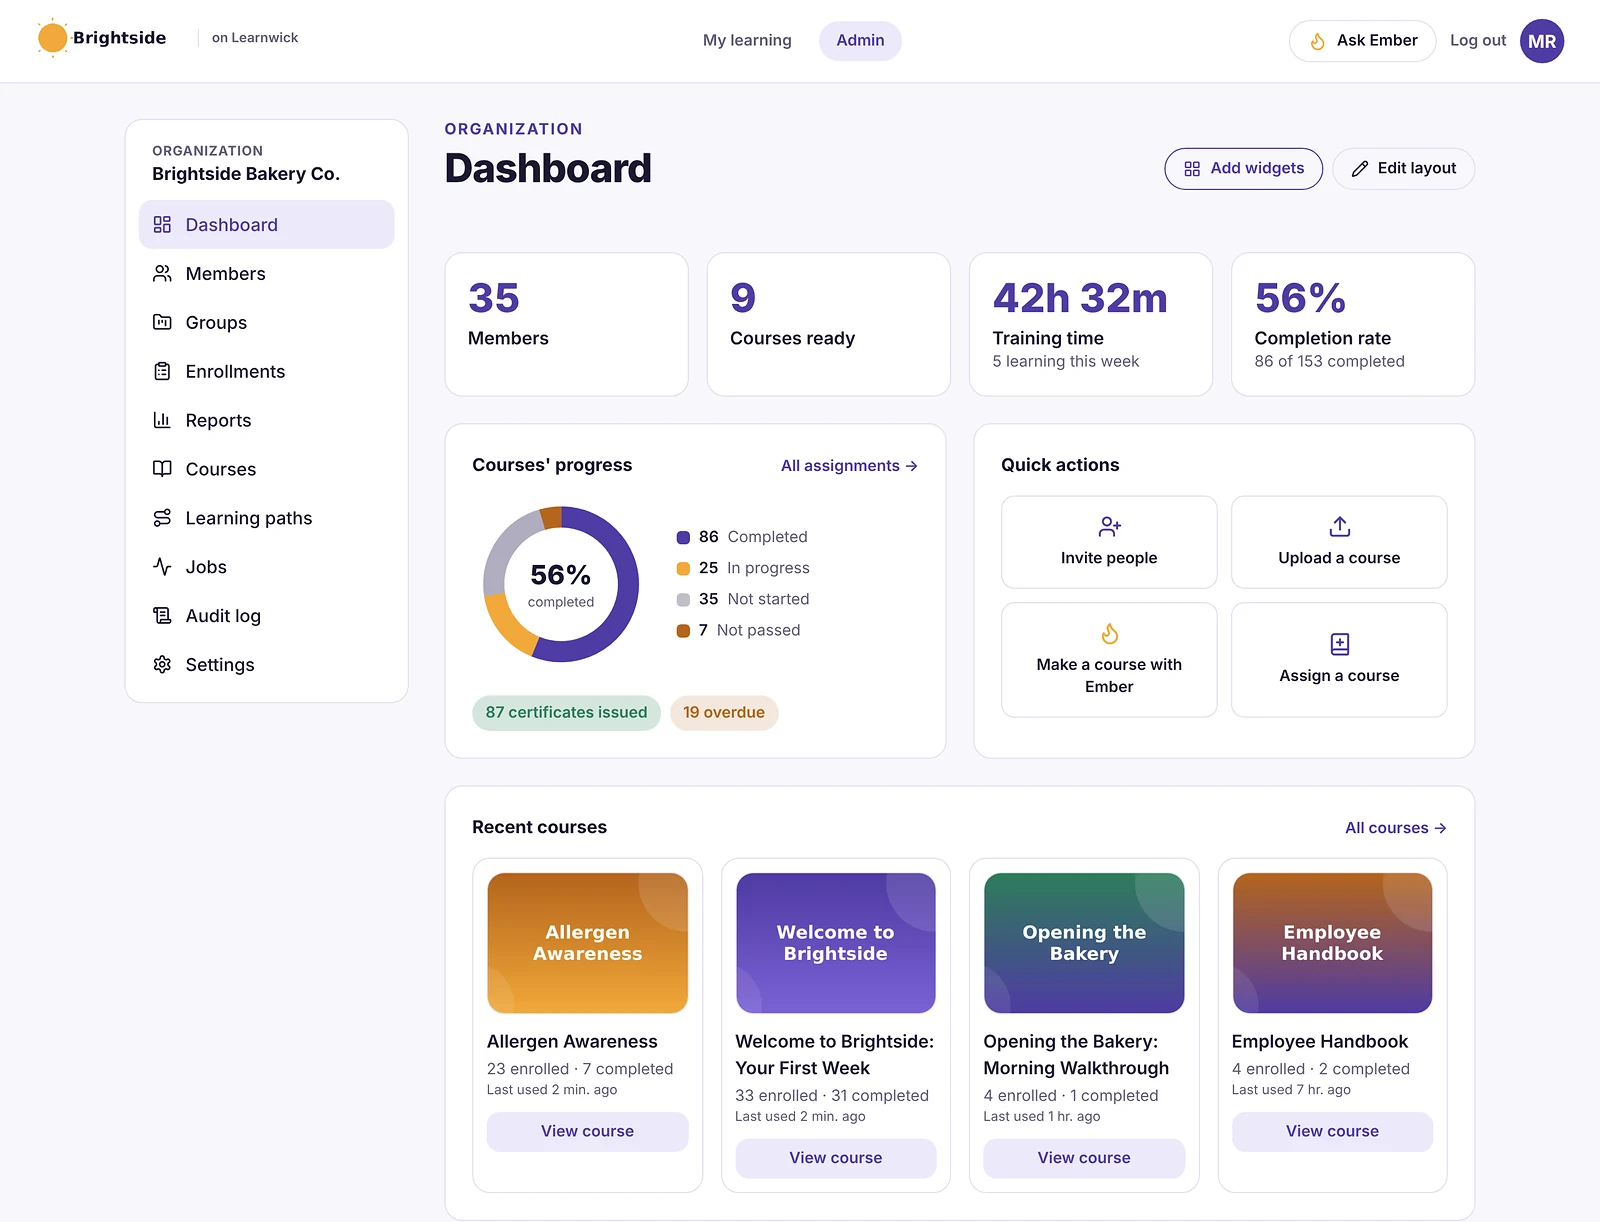
A dashboard for the whole team at a glance
The admin dashboard shows members, courses, training time, completion rate, course progress, recent courses, what happened lately and group performance. Each admin chooses and orders their own cards.
How it works
- 1
Pick a report
Or start a dashboard from suggested charts.
- 2
Filter it
By group, course and date range.
- 3
Share it
Export to CSV or PDF.
Questions about LMS Reporting and Training Analytics
What reports does Learnwick have?
Completion rates, overdue training, at-risk training, time spent, an activity timeline, quiz performance and custom reports — plus build-your-own analytics dashboards.
Can I export LMS reports?
Yes. Every report exports to CSV, and to PDF for sharing with managers, clients or auditors.
Can managers see their own team?
Group managers can be set for each group, and reports can be filtered by group.
Can I build custom reports?
Yes. Custom reports let you choose people, courses or assignments, filter them with rules and pick the columns you need.
Related features
Compliance Training Software for Small Business
Due dates, overdue reports, yearly renewals and audit-ready records.
Online Quiz Maker for Employee Training
Quizzes with pass marks, tries and explanations, marked automatically.
SCORM LMS for Small Business
Upload SCORM 1.2 and 2004, videos and PDFs. Scores and completion are tracked.
Give your team training they’ll actually finish
Free for up to 30 learners. No credit card, no sales call. Every feature on every plan.